
How to Measure Wellness Program ROI and Prove It with Precision
Most programs count participation. Precision Health Reports measures outcomes that translate into real savings—using guideline-harmonized risk and outcome-proven biomarkers.
Risk Reduction Programs Supported by Guidelines from:


TL;DR: Real ROI doesn’t come from counting steps or lunch-and-learns. It comes from reducing measurable cardiometabolic risk—then translating that change into avoided claims and productivity gains. Your differentiator: Precision Health Reports (PHR) provides the measurement layer (baseline risk, progress-to-goal) that makes ROI credible.
Most programs report participation (“70% completed a challenge”) or satisfaction (“4.6/5 stars”). Helpful for engagement? Sure. Predictive of financial value? Not really.
Three realities make ROI tricky:
Interventions vary wildly: Coaching, nutrition, medication, GLP-1s, etc., and other costs live outside your control.
Lagging financial outcomes: Claims appear months to years after behavior change.
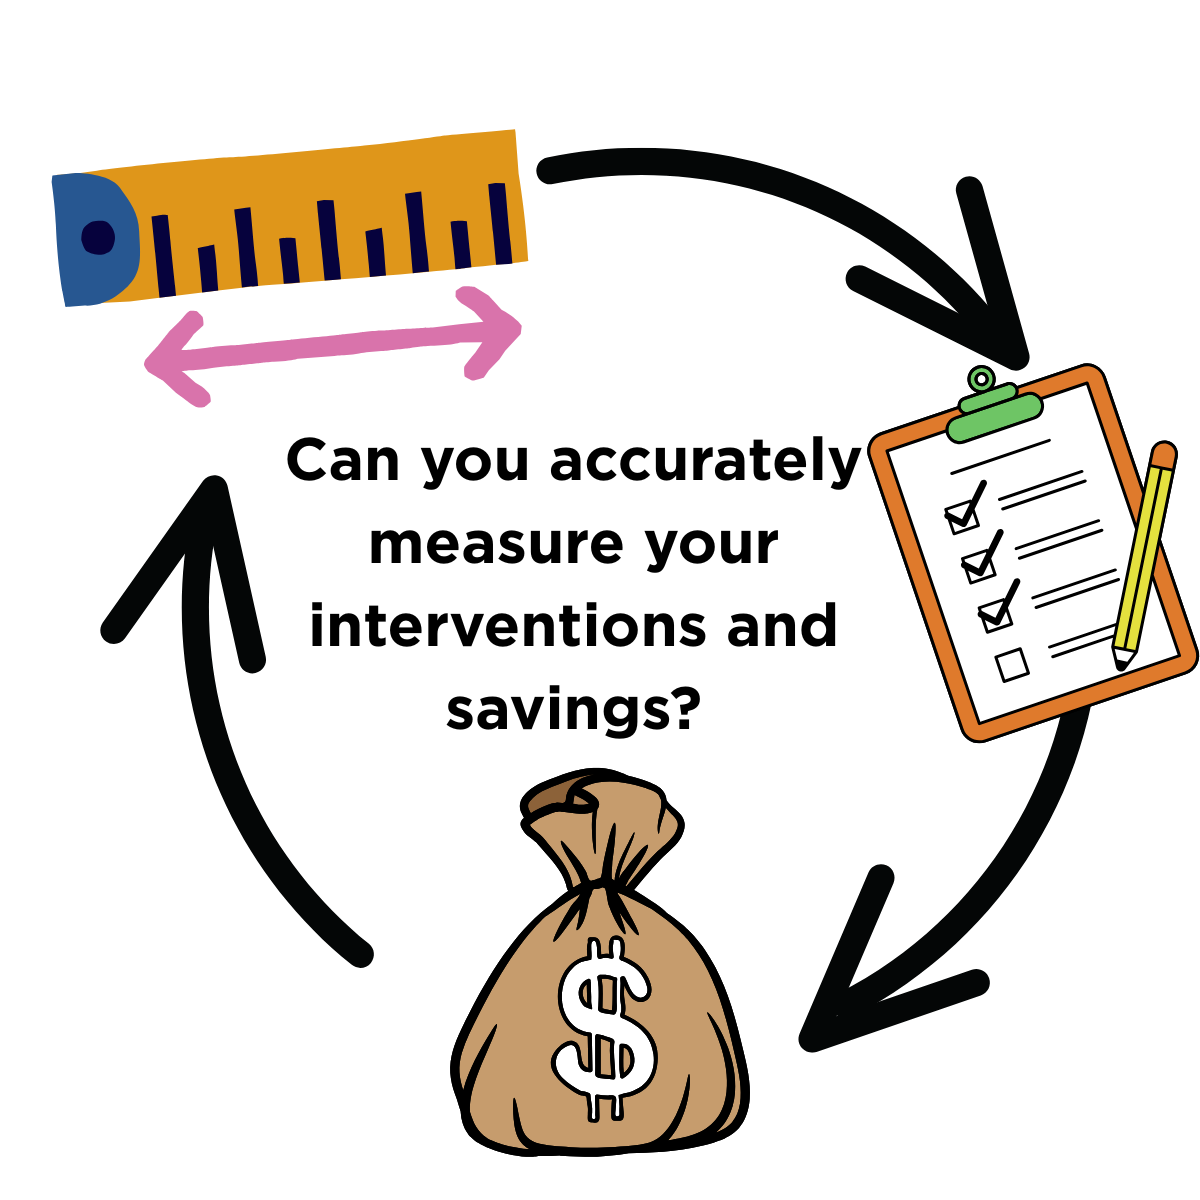
Weak measurement: Without precise risk assessment at baseline and over time, you can’t prove what changed or why.
Why Wellness ROI Is Hard to Measure
The Three Components of Wellness ROI
1) Direct Medical Cost Savings
This captures avoided high-cost claims and chronic disease spend. If you don’t have claims data, you can use credible, directional benchmarks:
ASCVD events (heart attack, stroke): high acute costs in year one plus follow-on spend.
Type 2 diabetes: substantial annual per-member costs that compound with complications.
Hypertension/Metabolic syndrome: risk amplifiers that raise total cost of care.
2) Productivity Gains (Absenteeism + Presenteeism)
Unmanaged cardiometabolic disease drives missed days and reduced performance at work. While numbers vary by industry and job type, incorporating even modest improvements in absenteeism/presenteeism frequently doubles the apparent ROI relative to claims-only views.
3) Risk Stratification & Measurement (Your Superpower)
Precision Health Reports turns vague wellness into auditable outcomes that you can measure:
Baseline: guideline-harmonized risk across ASCVD, T2D, and metabolic syndrome using outcome-proven biomarkers (e.g., ApoB, Lp(a), insulin resistance (LP-IR), demographics, and clinical history.
Progress to goal: clear targets and percent-to-goal over time.
Attribution: link risk moves to time-bound interventions to estimate avoided events/costs.
This is the piece employers and advisors usually lack and it’s the difference between “we think it worked” vs. “we can show you it worked.”
Program Cost
Employees × Participation Rate × Budget per Participant/Year
Medical Savings
Affected Population × Baseline Annual Cost × Expected % Reduction from Risk Reduction
Productivity Savings
Participants × Estimated Days Improved × Value per Workday
Net Savings
Gross Savings (medical + Productivity) − Program Cost
Step-by-Step: How We Measure ROI Within your Organization with a Precision Lense
Step 1: Establish Baseline Risk (Month 0)
Run a Cardiometabolic Risk Assessment screening across your full workforce (or a targeted high-risk cohort).
We then segment by risk tier and condition domain (ASCVD risk drivers, insulin resistance/T2D risk, metabolic syndrome).
Step 2: Define Targets and Interventions (Month 0–1)
Align each cohort to evidence-based personalized targets (e.g., ApoB to guideline-consistent goal ranges).
Stratify risk categories from “high touch; follow-up within 4-6 months” through “self-managed; reevaluate annually”.
Support clinical decision-maker to choose interventions (care navigation, nutrition, medication, activity, GLP-1s where appropriate). Document who gets what intervention(s).
Step 3: Track Progress-to-Goal (Quarterly or Semi-Annual)
Re-measure with Follow-up Assessment(s) as individually necessary.
Quantify percent-to-goal and the share of participants hitting targets.
Step 4: Convert Risk Reduction into Dollars
Medical savings: Apply conservative %-reduction factors to cohorts that improved (e.g., a high-risk lipid cohort moving to goal → apply a modest expected reduction in event-related costs).
Productivity gains: Apply a small, defendable improvement in absenteeism and presenteeism for participants who improved risk status.
Step 5: Report Net Savings and ROI
We reflect Gross Medical Savings, Gross Productivity Savings, Program Spend, Net Savings, and ROI Multiple.
Together, we re-evaluate for annual program renewal.