Metabolic Syndrome Severity Score (MSSS) Calculator
Standard metabolic syndrome diagnosis requires a patient to meet three or more of five criteria. That threshold creates a clinical artifact: a patient with a fasting glucose of 101 mg/dL, a waist of 36 inches, and triglycerides of 152 mg/dL qualifies, and so does a patient with a fasting glucose of 195 mg/dL, a waist of 52 inches, and triglycerides of 380 mg/dL. The diagnosis is the same. The risk is not.
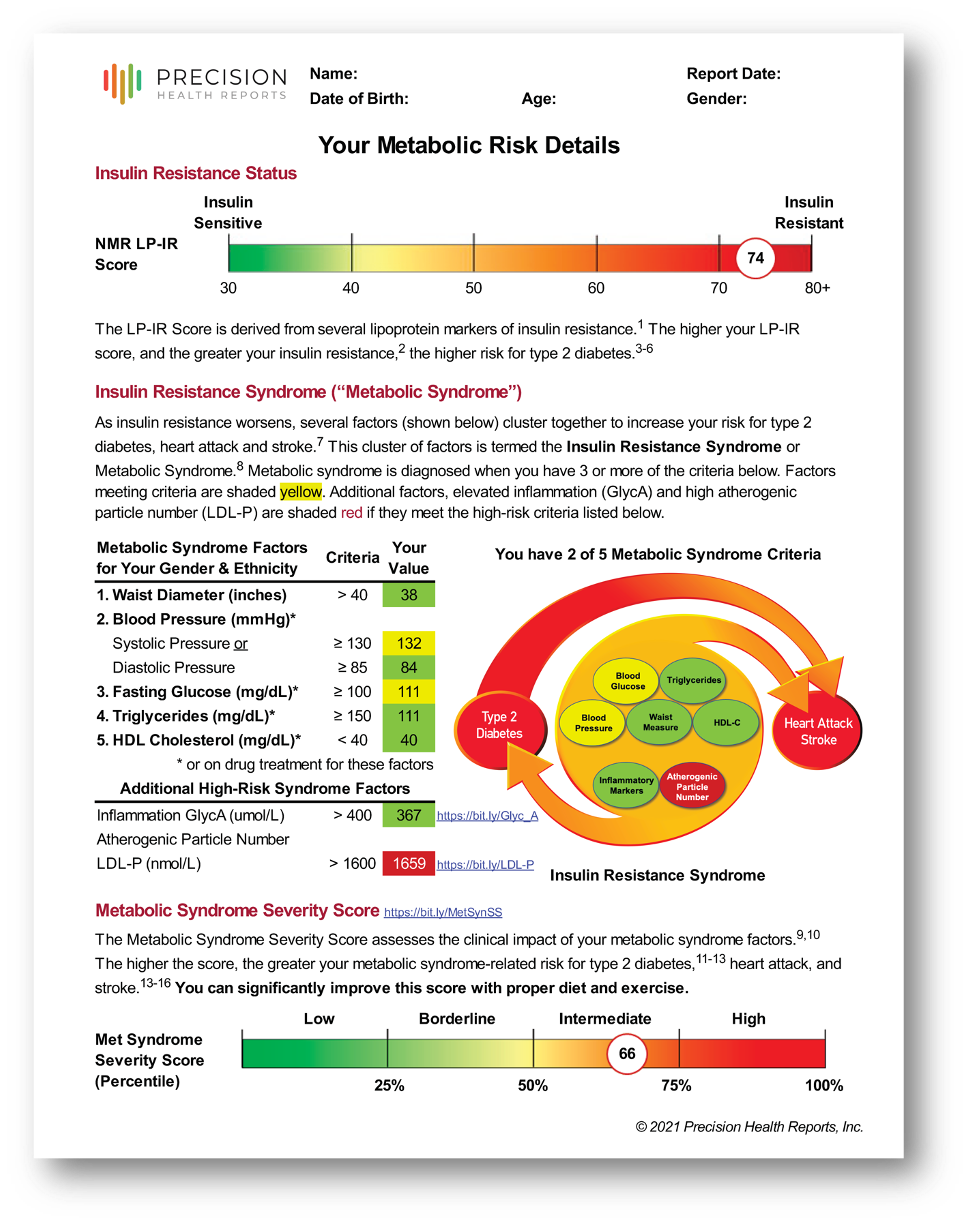
The Metabolic Syndrome Severity Score (MSSS) replaces the binary diagnosis with a continuous measure derived from all five metabolic syndrome components simultaneously, adjusted for your patient's age, sex, and race/ethnicity. The result is a BMI-based MetS Percentile — a population-referenced ranking that tells you not just whether metabolic syndrome is present, but how severe it is relative to a comparable demographic group, and whether it's improving or worsening over time.
This calculator is free and requires no Precision Health Reports clinical account. The BMI-based MetS Percentile it produces is the same MSSS output used in all Precision Health Reports Cardiometabolic Risk Aassessments and Advanced Metabolic Health Assessments.
How to Use This Calculator
Input your patient's age, sex, race/ethnicity, height, weight, waist circumference, HDL cholesterol, triglycerides, systolic blood pressure, and fasting glucose. The calculator returns two outputs:
BMI-based MetS Percentile: the primary clinical output; uses BMI as the central obesity measure and produces a population-percentile rank adjusted for age, sex, and race/ethnicity. This is the metric used in all PHR cardiometabolic assessments.
Waist-based MetS Percentile: an alternative output using waist circumference in place of BMI; useful for cross-referencing or when BMI is less reliable (e.g., high muscle mass patients)
Both outputs are population-referenced, meaning the percentile reflects where your patient falls relative to a demographically matched group, not a fixed absolute threshold. A higher percentile indicates greater metabolic syndrome severity within that reference population.
Metabolic Syndrome Severity Score Calculator
Enter your values below. Units: inches / pounds. Results are informational only.
Interpreting Your Patient's Score
The BMI-based MetS Percentile can be interpreted in the following clinical context:
| MetS Percentile | Category | Clinical Context |
|---|---|---|
| 0 – 25th | Low | Below-average metabolic syndrome burden for age, sex, and race/ethnicity. Risk factor clustering is well-controlled relative to peers. Continue monitoring as part of routine cardiometabolic follow-up. |
| 25th – 50th | Borderline | Moderate metabolic burden. Risk factor clustering is present but not yet severe. Lifestyle optimization — diet quality, physical activity, and weight management — is the primary intervention target at this stage. |
| 50th – 75th | Intermediate | Elevated metabolic burden. Insulin resistance is likely a contributing driver. Active risk factor management is indicated; consider evaluating LP-IR, ApoB, and 10-year ASCVD risk alongside MSSS for complete cardiometabolic stratification. |
| 75th – 100th | High | High metabolic syndrome severity. Significantly elevated near-term risk for type 2 diabetes and atherosclerotic cardiovascular disease. Intensive lifestyle and/or pharmacologic intervention is warranted; full cardiometabolic risk stratification is strongly recommended. |
Important clinical note on percentile interpretation: MSSS percentiles are age-, sex-, and race/ethnicity-adjusted. A 65-year-old patient at the 60th percentile carries a different absolute risk than a 35-year-old at the same percentile. The score measures relative severity within a comparable population group, not absolute 10-year event probability. For absolute risk, integrate MSSS with validated ASCVD calculators and advanced biomarkers (see below).
Tracking changes over time: MSSS is designed for serial measurement. A meaningful reduction in BMI-based MetS Percentile over 6–12 months reflects genuine improvement across the full cluster of metabolic components and has been correlated with reduced diabetes progression in intervention studies. It provides a single composite number for communicating treatment response to patients and colleagues, more precise than monitoring five separate lab values independently.
Why Continuous Scoring Matters Clinically
The pre-threshold patient problem: Under categorical criteria, a patient who meets two of five criteria receives no diagnosis and no formal risk classification, even if both values are just below threshold and trending worsening. MSSS captures this patient's actual position on the risk continuum. Early identification of patients in the 60th–75th percentile range, before a categorical diagnosis is warranted, creates a window for intervention that categorical criteria miss entirely.
The within-diagnosis heterogeneity problem: Among patients who do carry a metabolic syndrome diagnosis, the categorical approach groups a borderline patient (three barely-qualifying factors) with a severely affected patient (five markedly elevated factors) into the same clinical category. MSSS stratifies these patients meaningfully, supporting more calibrated pharmacologic and lifestyle intervention decisions.
Responding to intervention: When a patient loses 15 lbs, starts a statin, or begins a GLP-1 agonist, standard metabolic syndrome criteria may not capture the change until a threshold is crossed. MSSS reflects incremental improvement in all five components simultaneously, making it a more responsive and motivating tracking metric. For patients where lipid-lowering therapy is also indicated, see our Medication Effect Calculator to project the impact of statin, PCSK9 inhibitor, and adjunct therapy combinations on ApoB and non-HDL.
MSSS in the Context of Full Cardiometabolic Risk
MSSS quantifies metabolic syndrome severity, but metabolic syndrome is one dimension of cardiometabolic risk, not the whole picture. A patient with a high MSSS may have well-controlled atherogenic particle burden; a patient with a low MSSS may carry significant Lp(a)-mediated risk that no metabolic marker would capture.
Complete cardiometabolic risk stratification requires integrating MSSS with:
ApoB / LDL-P — atherogenic particle number, which predicts ASCVD events independently of LDL-C
LP-IR score — NMR-derived insulin resistance index; detects compensatory hyperinsulinemia before glucose is affected
Lipoprotein(a) — genetically determined ASCVD and aortic stenosis risk; unaffected by lifestyle or most medications
10-year ASCVD risk — harmonized across ACC/AHA, ESC, ADA, and NLA guidelines
All Assessments from Precision Health Reports integrate MSSS with these markers into a single interpreted report, with guideline-concordant therapeutic targets personalized to each patient's risk profile.
FOR CLINICIANS
See how MSSS Integrates into a full Cardiometabolic Risk Assessment
Precision Health Reports combines you patient’s BMI-based MetS Percentile with ApoB, LP-IR, Lp(a), and PREVENT ASCVD risk with 30+ additional risk enhancing factors into a single interpreted report that includes guideline-concordant therapeutic targets personalized to their risk profile
Evidence Base and Validation
The MSSS was developed and validated by Gurka, DeBoer, and colleagues across multiple prospective cohort studies, including populations from the Atherosclerosis Risk in Communities (ARIC) study, the Jackson Heart Study, and the National Diabetes Prevention Program (DPP). Key validation findings:
MSSS outperforms categorical metabolic syndrome diagnosis in predicting incident type 2 diabetes and atherosclerotic cardiovascular disease across non-Hispanic White, non-Hispanic Black, and Hispanic American populations¹
Higher MSSS percentile scores are associated with significantly elevated risk of incident T2D and ASCVD events in sex- and race-stratified models¹ ²
MSSS is sensitive to intervention-driven change, demonstrating responsiveness to lifestyle modification in DPP participants²
Race/ethnicity-specific scoring coefficients correct for the differential distribution of metabolic syndrome components across populations, improving validity in diverse clinical settings¹
Frequently Asked Questions about the Metabolic Syndrome Severity Score
-
The calculator requires age, sex, race/ethnicity (non-Hispanic White, non-Hispanic Black, or Hispanic), height, weight, waist circumference, HDL cholesterol, triglycerides, systolic blood pressure, and fasting glucose. All values are typically available from a standard metabolic panel and basic vitals with no additional lab orders are required.
-
The BMI-based MetS Percentile is a population-referenced measure of metabolic syndrome severity, adjusted for your patient's age, sex, and race/ethnicity. It tells you where your patient falls on the metabolic syndrome severity spectrum relative to a demographically matched group. Percentiles above the 75th represent high metabolic burden; percentiles at or above the 90th represent severe metabolic syndrome with materially elevated near-term risk for T2D and ASCVD events. This is the metric used in all of our Cardiometabolic Risk Assessments.
-
Yes! This is one of MSSS's primary clinical utilities. Serial measurements every 3–6 months capture incremental improvements across all five metabolic components simultaneously, reflected as a change in BMI-based MetS Percentile. A meaningful reduction in percentile over 6–12 months has been correlated with reduced diabetes progression in intervention studies.
-
Standard criteria apply a binary threshold: three or more of five factors = metabolic syndrome present. MSSS integrates all five factors into a continuous score weighted by their contribution to cardiometabolic risk, adjusted for the patient's demographic group. MSSS captures risk in patients who don't yet meet categorical criteria and differentiates risk severity among those who do.
-
Yes. The MSSS uses race/ethnicity-specific scoring coefficients derived from ARIC, the Jackson Heart Study, and the DPP, which included non-Hispanic White, non-Hispanic Black, and Hispanic American participants. This makes MSSS more reliable in diverse clinical populations than fixed categorical thresholds.
-
No. This calculator is free and standalone—no formal relationship required. If you'd like to integrate MSSS into a comprehensive cardiometabolic assessment for your patients, see the ordering information below or reach out to hello@precisionhealthreports.com.
-
Precision Health Reports integrates MSSS with ApoB, LP-IR score, Lp(a), PREVENT ASCVD risk, and 8-year diabetes risk into a single interpreted report with patient-specific therapeutic targets. The MSSS is presented in context with the patient's full cardiometabolic risk profile and guideline-concordant recommendations.
-
The current MSSS validation cohorts include non-Hispanic White, non-Hispanic Black, and Hispanic American populations. For patients outside these groups, the calculator will still produce a BMI-based MetS Percentile, but interpret it with appropriate caution given the validation limitations. PHR's assessments use the closest validated reference population in these cases.
Order a Complete Cardiometabolic Assessment for Your Patient
The MSSS calculator gives you one validated piece of the picture. A full Assessment integrates MSSS with ApoB, LP-IR, Lp(a), PREVENT ASCVD risk, 8-year diabetes risk, and harmonized guideline-based therapeutic targets, all delivered in a single interpreted report in 3–4 business days.
No contract required. No minimum volume. No setup cost.
Orders take under 30 seconds via our secure provider portal. You submit the order and receive the completed report. We coordinate with the patient for their relevant clinical history and LabCorp blood draw.
→ View a sample PHR report
→ Book a 15-minute intro call
→ Order one for your patient—no contract required to try us out
References:
Gurka MJ, Filipp SL, DeBoer MD. Geographical variation in the prevalence of obesity, metabolic syndrome, and diabetes among US adults. Nutr Diabetes. 2018;8(1):14.
Gurka MJ, Lilly CL, Oliver MN, DeBoer MD. An examination of sex and racial/ethnic differences in the metabolic syndrome among adults: a confirmatory factor analysis and a resulting continuous severity score. Metabolism. 2014;63(2):218–225.
DeBoer MD, Gurka MJ, Golden SH, et al. Independent associations between metabolic syndrome severity and future coronary heart disease by sex and race. J Am Coll Cardiol. 2018;72(10):1088–1097.