HOMA-IR: What It Is, Formula, Normal Range, and Meaning
HOMA-IR (Homeostatic Model Assessment of Insulin Resistance) is a calculated index that estimates insulin resistance using fasting glucose and fasting insulin levels. It helps detect early metabolic dysfunction before blood sugar levels rise into the prediabetes or diabetes range.
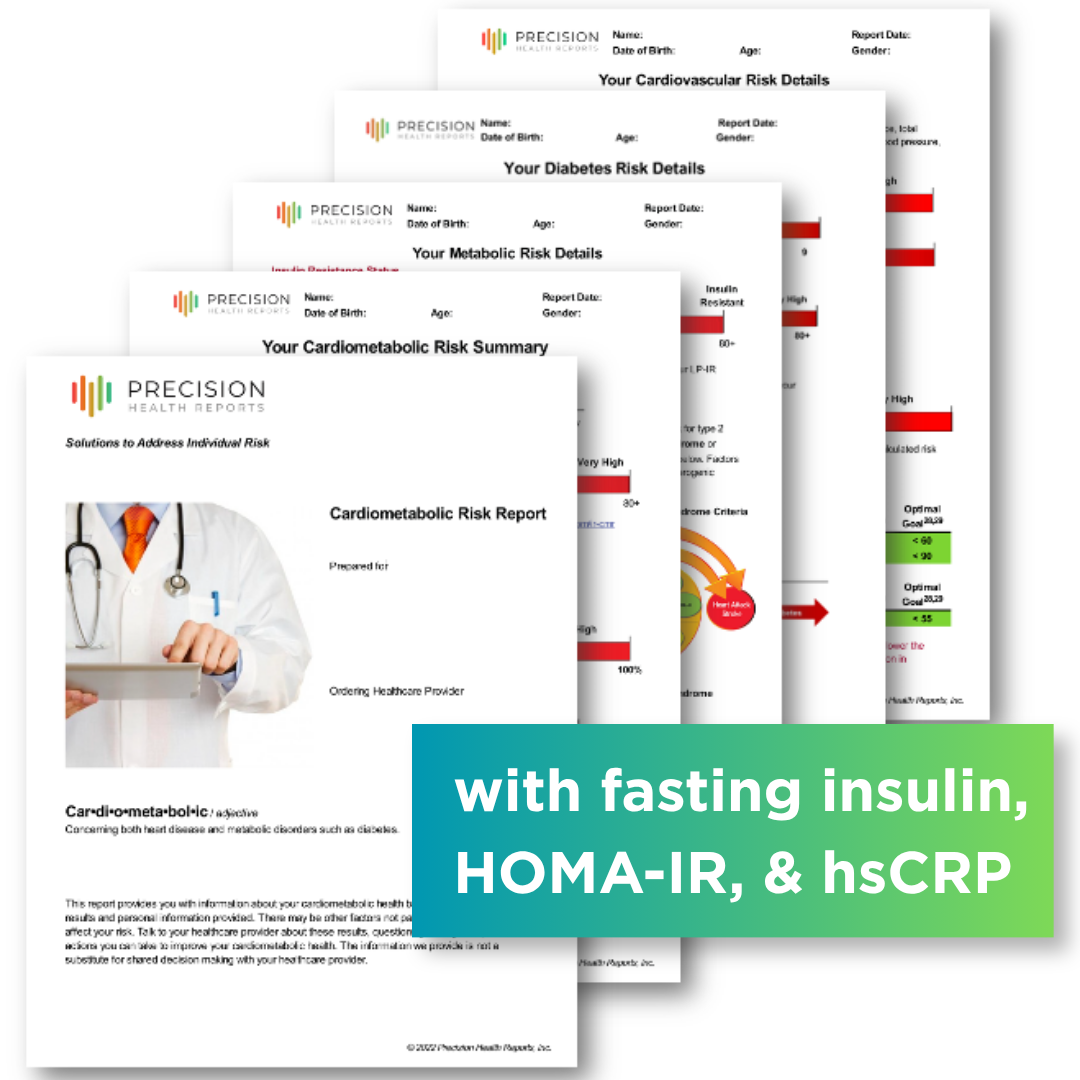
CARDIOMETABOLIC RISK ASSESSMENT WITH HOMA-IR
Ready for Your Own Assessment to Understand How Your HOMA-IR Affects Your Cardiometabolic Risk?
Each Assessment comes with labs from Quest Diagnostics including fasting insulin to measure your HOMA-IR and your risk in context for you.
Quick and Easy. FSA eligible. Physician-ready report.
What Is HOMA-IR?
HOMA-IR is a mathematical model developed in 1985 to estimate insulin resistance and beta-cell function using routine fasting lab values instead of complex metabolic testing such as the euglycemic clamp.
It is not a direct laboratory measurement. It is a derived calculation based on fasting glucose and fasting insulin.
Fast Facts about HOMA-IR:
HOMA-IR estimates insulin resistance
Calculated from fasting insulin and fasting glucose
Detects early metabolic dysfunction
Values above 2.0 often suggest developing insulin resistance
Should be interpreted in clinical context
HOMA-IR Formula (How to Calculate It)
Formula Using mg/dL (U.S. Standard)
HOMA-IR = (Fasting Insulin µIU/mL × Fasting Glucose mg/dL) ÷ 405
Formula Using mmol/L (SI Units)
HOMA-IR = (Fasting Insulin mIU/L × Fasting Glucose mmol/L) ÷ 22.5
Your HOMA-IR is one piece of your cardiometabolic risk, see your full picture.
What Is a Normal HOMA-IR?
There is no universal diagnostic cutoff, but common interpretation ranges are:
| HOMA-IR Value | Typical Interpretation |
|---|---|
| < 1.0 | High insulin sensitivity; often seen in metabolically healthy individuals. |
| 1.0–1.9 | Generally favorable range in many adult populations. |
| 2.0–2.9 | Early insulin resistance; may indicate developing metabolic dysfunction. |
| 3.0–4.9 | Elevated insulin resistance; associated with higher cardiometabolic risk. |
| ≥ 5.0 | Marked insulin resistance; often seen in metabolic syndrome or type 2 diabetes. |
These ranges are for educational purposes and may not reflect the specific reference intervals used by your laboratory. HOMA-IR exists on a continuum of metabolic risk and should be interpreted alongside A1c, fasting glucose, lipid markers, body composition, ethnicity, and overall cardiometabolic risk assessment in consultation with a qualified clinician.
HOMA-IR exists on a continuum of metabolic risk rather than a binary disease threshold. “The lower, the longer, the better.”
What Does an Elevated HOMA-IR Mean?
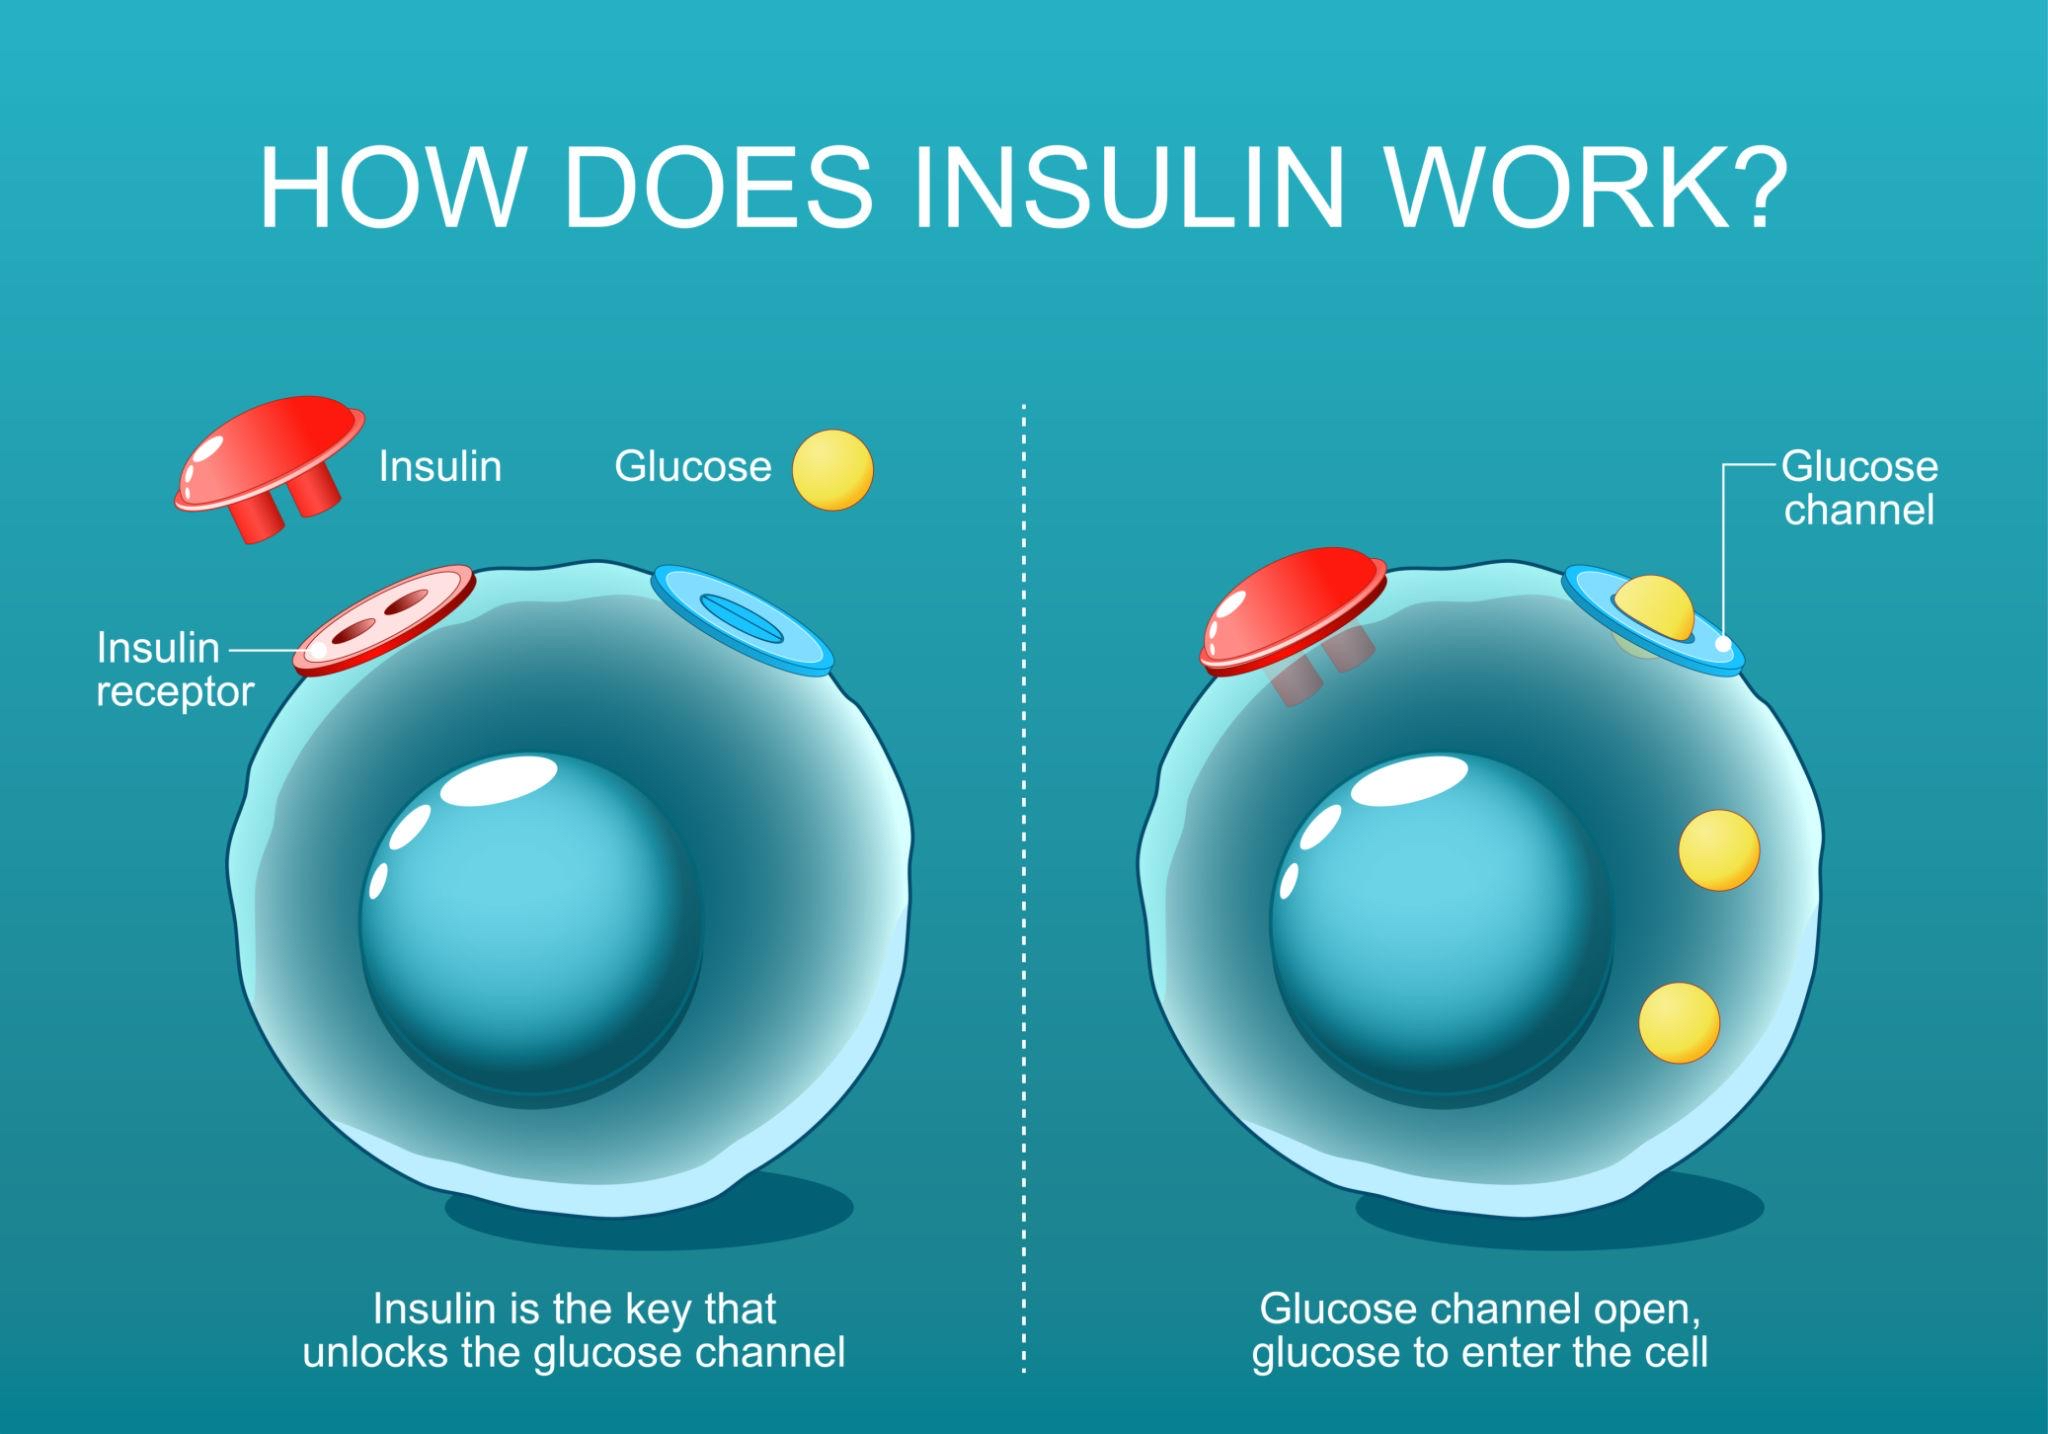
An elevated HOMA-IR suggests that the body requires higher insulin levels to maintain normal blood glucose. This condition is known as insulin resistance.
Over time, insulin resistance may contribute to:
Metabolic syndrome
Prediabetes and type 2 diabetes
Atherosclerotic cardiovascular disease
Fatty liver disease
Polycystic ovarian syndrome
In many individuals, HOMA-IR rises before A1c or fasting glucose becomes abnormal.
HOMA-IR vs A1c: What Is the Difference?
HOMA-IR measures current insulin resistance physiology.
A1c measures average blood glucose over approximately three months.
It is possible to have:
Normal A1c
Normal fasting glucose
Elevated HOMA-IR
That pattern often reflects early compensatory hyperinsulinemia.
HOMA-IR vs Fasting Insulin
Fasting insulin alone does not account for glucose levels. HOMA-IR integrates both values, improving context.
For example:
Insulin 15 µIU/mL + Glucose 85 mg/dL → HOMA-IR ≈ 3.15
Insulin 15 µIU/mL + Glucose 100 mg/dL → HOMA-IR ≈ 3.7
The second scenario reflects greater metabolic strain than fasting insulin alone, because it accounts for the added context of the individual’s current glycemic state.
HOMA-IR vs LP-IR
LP-IR is an insulin resistance score derived from lipoprotein particle characteristics measured by NMR.
Key differences:
HOMA-IR uses insulin directly
LP-IR reflects metabolic patterns through lipoprotein particles
Both can provide insight into metabolic risk and may move in similar directions clinically.
| Feature | HOMA-IR | LP-IR |
|---|---|---|
| What it reflects |
A glucose–insulin based estimate of insulin resistance derived from fasting labs.
Direct insulin signal
Fasting required
|
A lipoprotein-pattern based insulin resistance score derived from NMR particle characteristics.
Pattern-based signal
Fasting required
|
| Inputs | Fasting glucose + fasting insulin | NMR lipoprotein particle measures (composite score) |
| Availability | Widely available, low cost, can be run on most standard lab platforms | Available when an NMR panel that includes LP-IR is ordered (lab-dependent) |
| Best use case | Practical screening and monitoring when fasting labs are available and you want an interpretable insulin-based estimate. | Convenient screening and monitoring for earliest IR signals or when you also want advanced lipoprotein insights in the same draw. |
| How to interpret | Interpreted using population-based ranges; values trend with insulin resistance and cardiometabolic risk. | Interpreted as a score (higher generally indicates more insulin resistance); often aligns with metabolic syndrome patterns. |
| Bottom line | Near-peers: both can identify insulin resistance earlier than glucose-based diagnosis alone. When both are available, they are complementary. When only one is available, either can provide meaningful direction for prevention-focused care. | |
This comparison is for education. Individual results should be interpreted in clinical context alongside A1c, fasting glucose, triglycerides, waist circumference, blood pressure, family history, medications, and overall cardiometabolic risk.
When Is HOMA-IR Most Useful?
HOMA-IR adds value in:
Early metabolic risk screening
Lean individuals with family history of diabetes
Evaluation of metabolic syndrome features
NAFLD workup
PCOS evaluation
Cardiometabolic prevention programs
Limitations of HOMA-IR
HOMA-IR does have some limitations for practical use and should only be looked at in the context of the individual’s overall cardiometabolic health:
Requires accurate fasting insulin measurement
Assumes stable beta-cell function
Less reliable in advanced diabetes
No universally accepted clinical cutoff
Can vary by assay methodology
It is best used as a risk stratification tool rather than a standalone diagnostic test.
How to Improve HOMA-IR
HOMA-IR often improves with:
Weight reduction
Resistance training
Aerobic exercise
Sleep optimization
Reduced refined carbohydrate intake
GLP-1 receptor agonists
Metformin
SGLT2 inhibitors
Improvements frequently parallel reductions in visceral adiposity.
Remember, as insulin sensitivity improves, future risk for developing type 2 diabetes and metabolic syndrome also improve.
FAQs about HOMA-IR
-
Yes. Fasting for 8–12 hours is required for accurate interpretation.
-
No. It estimates insulin resistance. Diabetes diagnosis relies on glucose-based criteria.
-
Yes. Insulin resistance and body weight are related but not identical.
-
In many U.S. adults, values under 2.0 are often considered metabolically favorable, though optimal targets depend on context.
Additional References: HOMA-IR
1) Matthews DR, Hosker JP, Rudenski AS, et al. (1985)
2) Wallace TM, Levy JC, Matthews DR (2004)
“Use and Abuse of HOMA Modeling.” Diabetes Care.
3) Tahapary DL, et al. (2022)
4) Rudvik A, Månsson M (2018)
5) Tam CS, Xie W, Johnson WD, et al. (2012)
6) American Diabetes Association (ADA) – patient-friendly background
“Insulin Resistance and Diabetes.”
7) ADA Standards of Care 2026 (overview / press release)
“The American Diabetes Association Releases Standards of Care in Diabetes—2026.”