What you learn from your Advanced Metabolic Health Assessment Report

If you have completed your Advanced Metabolic Health Assessment report, it is important to understand your results and build a plan of action to maintain your health and make course corrections where appropriate.
We strongly recommend that before taking ANY action based on this diagnostic risk assessment, you should read through your report thoroughly and consult with your physician.
If you haven’t completed the Advanced Metabolic Health Assessment, you can get started quickly today!

A comprehensive and actionable risk assessment report to identify your individual risks for metabolic syndrome and type 2 diabetes.
Note: Available to residents 18 years of age and older in the U.S. only (for now).
You should only order our risk assessment products if you live within reasonable distance to a LabCorp Patient Service Center (PSC). We will send you an order for a single LabCorp visit to have your blood drawn. Find your nearest LabCorp facility.
What is in Your Advanced Metabolic Health Assessment Report
The Advanced Metabolic Health Assessment is a slimmed-down version of the comprehensive Cardiometabolic Risk Assessment. This report focuses on your metabolic risk and type 2 diabetes risk factors and leaves out the more complex cardiovascular risk factors. This allows a more focused approach to seeing and managing these earlier portions of the larger cardiometabolic disease picture.
Part 1: Your Metabolic Syndrome Risk Details
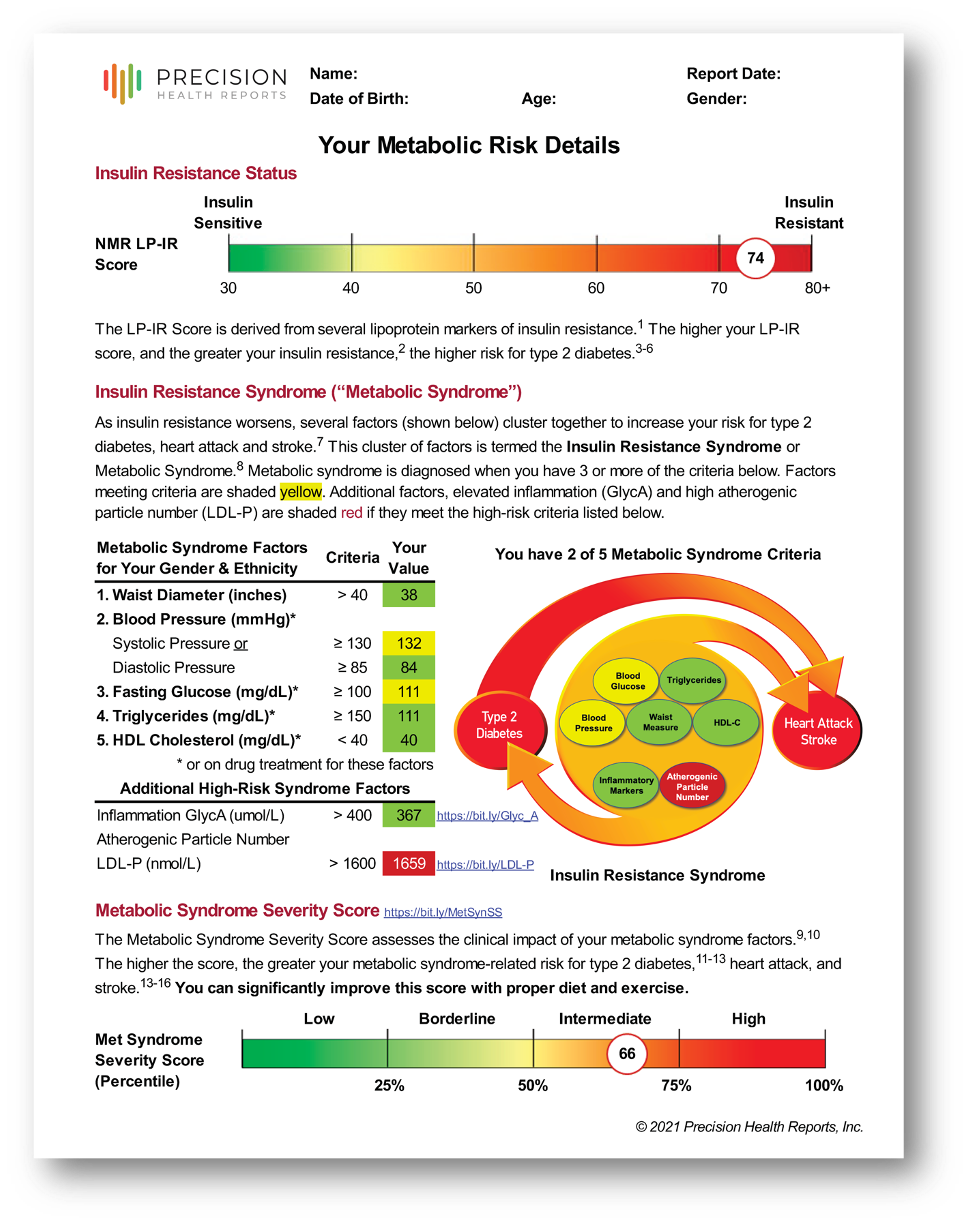
Identifies your insulin resistance status using the Lipoprotein Insulin Resistance (LP-IR) Score
Outlines your specific metabolic health goals and values that constitute metabolic syndrome
Reports high-risk inflammatory and lipoprotein particle number values that increase insulin resistance related to greater diabetic and cardiovascular risk
Incorporates an outcome-proven Metabolic Syndrome Severity Score that further discriminates individual risk beyond individual metabolic syndrome factors
Part 2: Your Diabetic Risk Details

Graphically presents the values necessary to assess your risk of type 2 diabetes including your current fasting glucose and NMR Lipoprotein Insulin Resistance (LP-IR) Score
Reports your gender-specific 8-Year Risk of Developing Diabetes based on outcome data integrating fasting glucose and LP-IR values
Demonstrates that your personal diabetic risk is modifiable through improvement in your LP-IR Score and fasting glucose values
Remember that your risk is modifiable and reducing your risk starts with reducing your insulin resistance (LP-IR score).
Part 3: Your Comprehensive Risk Tracking Charts

Clearly demonstrates the impact of clinical and behavioral interventions over time
The design visually reinforces improved behavior toward a healthier risk score
Cumulative tracking pages are a working document to set future goals
Seeing your body’s response over time has a positive association with reaching your goals. Positive feedback drives continued behavior improvements that you can see and feel!
Part 4: Links to Additional Information and Your Survey Answers
Additional information to links for topics including:
A rundown of your answers to your pre-assessment survey as a reference to recall how your answers affected your complete Cardiometabolic Risk Assessment
Part 5: LabCorp’s complete Nuclear Magnetic Resonance (NMR) LipoProfile® report and additional labs

Important lipoprotein values: ApoB
Traditional cholesterol and triglyceride values (total cholesterol, triglycerides, HDL & LDL cholesterol)
Fasting glucose & Lipoprotein Insulin Resistance (LP-IR) Score
Although our report wraps significant additional context around the point-in-time biomarkers from LabCorp’s NMR LipoProfile® report and the other advanced biomarkers, we know seeing the raw values is important, too.
A comprehensive and actionable risk assessment report to identify your individual risks for metabolic syndrome and type 2 diabetes.
Note: Available to residents 18 years of age and older in the U.S. only (for now).
You should only order our risk assessment products if you live within reasonable distance to a LabCorp Patient Service Center (PSC). We will send you an order for a single LabCorp visit to have your blood drawn. Find your nearest LabCorp facility.
The Advanced Metabolic Health Assessment is a slimmed-down version of the Cardiometabolic Risk Assessment. It is focused on metabolic health and diabetic risk only, while leaving out the cardiovascular risk portion that is sometimes distracting to people who are working on metabolic health first/only.
Our Advanced Metabolic Health Assessment gives you a complete picture of your:
Individual metabolic risk factors & Metabolic Syndrome Severity Score.
8-year Diabetic Risk and Lipoprotein Insulin Resistance Score (LP-IR).
Labs included: NMR-measured ApoB and cholesterol, insulin resistance, hemoglobin A1C, and fasting glucose.